
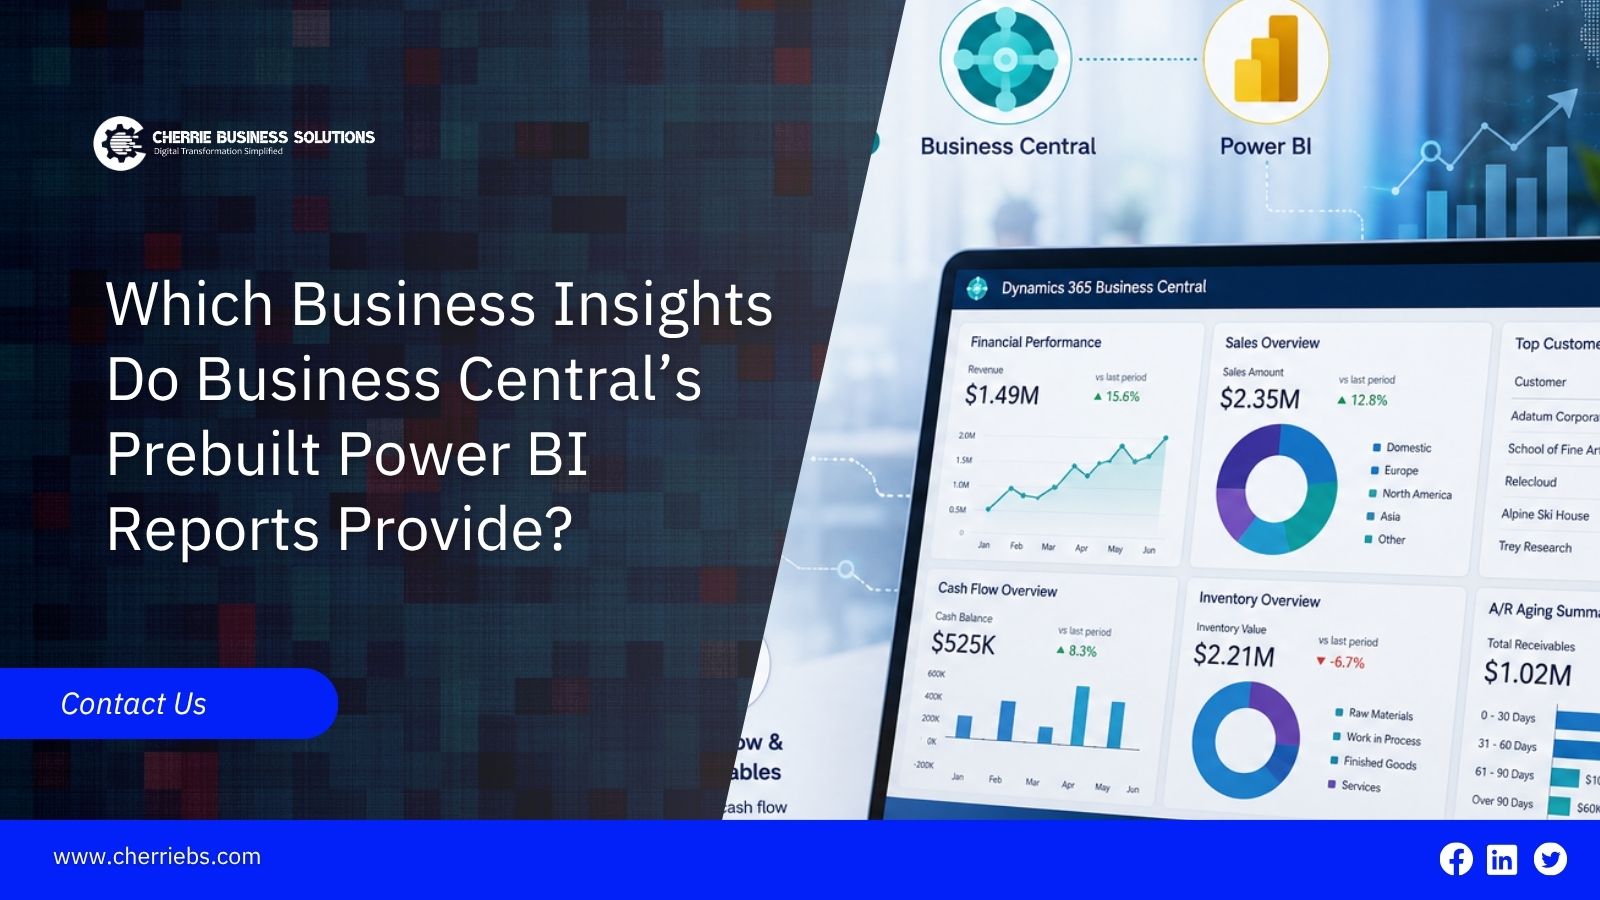
More businesses are connecting their Microsoft Dynamics 365 ERP systems to advanced analytics to support faster, more informed decision-making. By using visual reports rather than spreadsheets and raw data, finance and operations teams can easily monitor business performance and identify key trends.
Microsoft Dynamics 365 Business Central includes a range of ready-made Power BI reports that turn business data into meaningful insights.
But what can these prebuilt dashboards actually tell you?
From sales performance and cash flow to inventory and supply chain metrics, this article explores the key insights available through Business Central’s standard Power BI reports and where additional reporting capabilities may be needed.
1. Sales Performance Insights
Sales directors cannot wait for a monthly review to see if their team is hitting the targets. Prebuilt sales dashboards give managers immediate insights. These visual charts provide an up-to-date view of sales and order data, allowing you to monitor sales activity and order performance.
Customer purchasing habits: You can spot which clients are purchasing more this quarter and which buyers have suddenly stopped ordering.
Item sales metrics: The charts show the fastest-moving products in your catalog, helping you understand which products are generating the most sales.
Sales performance: Managers can review sales results and identify where additional sales support may be needed.
If a specific product line suddenly drops in sales, the dashboard makes the decline visually obvious. Your sales team can adjust their strategy before the quarter ends. Finding those sales trends is great, but you also need to know if that money is actually landing in your bank account.
2. Cash Flow and Financial Insights
Accounting teams often spend excessive time formatting spreadsheets to determine available cash flow. The standard finance reports change this by turning complex accounting entries into simple visual graphs. This gives business owners a clear picture of their financial health at a glance.
Cash flow insights: The reports can help teams monitor expected incoming payments and upcoming scheduled bills to help them understand future cash requirements better.
Receivables and payables aging: These charts group unpaid invoices into 30, 60, and 90-day categories so you know exactly who owes you money.
Budget versus actual variance: The reports highlight areas where departments are spending more money than originally planned, helping teams identify budget overruns early.
Seeing a visual spike in overdue customer payments prompts your finance department to start making collections calls before the cash flow dries up. While managing cash is a top priority, controlling your physical stock is just as important for protecting your budget.
3. Inventory and Supply Chain Insights
A warehouse holding too much slow-selling stock drains company cash. In fact, APQC benchmarking data reveals that inventory carrying costs typically consume 20% to 30% of a company’s total average inventory value each year. Procurement managers need accurate facts to balance what stays on the shelf and what needs to be ordered.
This is where Business Central and Power BI can provide a clearer view of inventory and supply chain performance. Built-in inventory reporting can use data from your inventory and warehouse records to provide a realistic view of your supply chain.
Current stock levels: You can see what is physically available in the building versus what is already reserved for a pending customer order.
Item turnover charts: The dashboards highlight slow-moving inventory that might need a price discount to free up valuable warehouse space.
Purchase order tracking: You can monitor incoming shipments so the receiving dock knows what supplier deliveries to expect on any given day.
When buyers have a clear view of how fast items leave the building, they stop guessing. They can set up better reorder points and avoid running out of popular products. Knowing your inventory is helpful, but you also need to know if the people you buy from and sell to are good for your business.
4. Customer and Vendor Insights
Building strong relationships with customers and suppliers requires a clear understanding of their historical performance. Standard reporting tools help your teams evaluate key performance trends and determine how each business partner contributes to your overall business performance.
Customer profitability tracking: This can help identify which customers generate the highest profit by comparing revenue with relevant discounts, costs, and other associated expenses when the required data is available.
Payment behavior charts: The visuals reveal which clients consistently pay their invoices late and cause administrative difficulties.
Vendor performance metrics: You can track supplier delivery histories to highlight which suppliers consistently meet delivery expectations and which may affect operational schedules.
Having this data on hand can provide a major competitive advantage. A Gartner survey found that only 29% of supply chain organizations have built the technological capabilities needed to support future performance. With better visibility into supplier and customer data, management can make more informed decisions about pricing and delivery terms, while sales teams can identify reliable customers and evaluate purchasing trends.
But external relationships are only one part of the picture. To get a complete view of business performance, you also need to measure how effectively your internal teams are performing.
5. Profitability and Operational Insights
Knowing the total company profit is helpful, but knowing exactly where that money came from is much better for long-term planning. Business Central uses dimensional tagging to slice your data into specific operational categories.
Margin analysis by product line: The reports can help show whether your hardware sales or your service contracts generate the most actual profit.
Department-level performance: You can break down revenue and expenses by different internal teams, store branches, or office locations.
Project tracking: Businesses can use Business Central data with customized Power BI reporting to monitor budgets, resource hours, and individual client jobs when these reporting requirements are configured.
These operational insights allow executives to make tough decisions confidently. They can invest more money into highly profitable services and fix the product lines that consistently lose money.
How to Access Business Central Power BI Reports
Users can access supported visual charts and Power BI insights within Business Central. Depending on the reporting setup, licensing, and configuration, requirements can vary. When setting up the system, IT teams generally consider two main reporting approaches.
Microsoft-provided Power BI content: This approach uses the prebuilt content provided by Microsoft. It requires minimal customization and gives your team access to standard operational reporting.
Custom Power BI Workspaces: This approach uses secure connections to bring ERP data into customized Power BI reporting. It is designed for businesses that want to blend financial data with visual analytics for highly specific, customized key performance indicators.
Both approaches give your team a solid foundation for data analysis. The key to success is choosing the technical route that fits your specific daily routines.
Next Steps: Plan Your Reporting Strategy With an Authorized Partner
Business Central’s prebuilt reports give finance, sales, and operations teams a useful view of sales activity, cash flow, and inventory levels. However, the value of these reports depends on how well they are configured around your business processes.
As an authorized Microsoft Dynamics 365 partner, Cherrie Business Solutions helps businesses align their Business Central reporting with their operational needs. Our team combines hands-on Business Central experience with industry knowledge to build dashboards that support everyday decisions, highlight important performance trends, and make reporting easier for your staff to use.
We also help your team understand the information behind each report so they can use it with confidence. Contact us today to explore our Business Central reporting and implementation services and make better use of the data already available in your ERP system.