
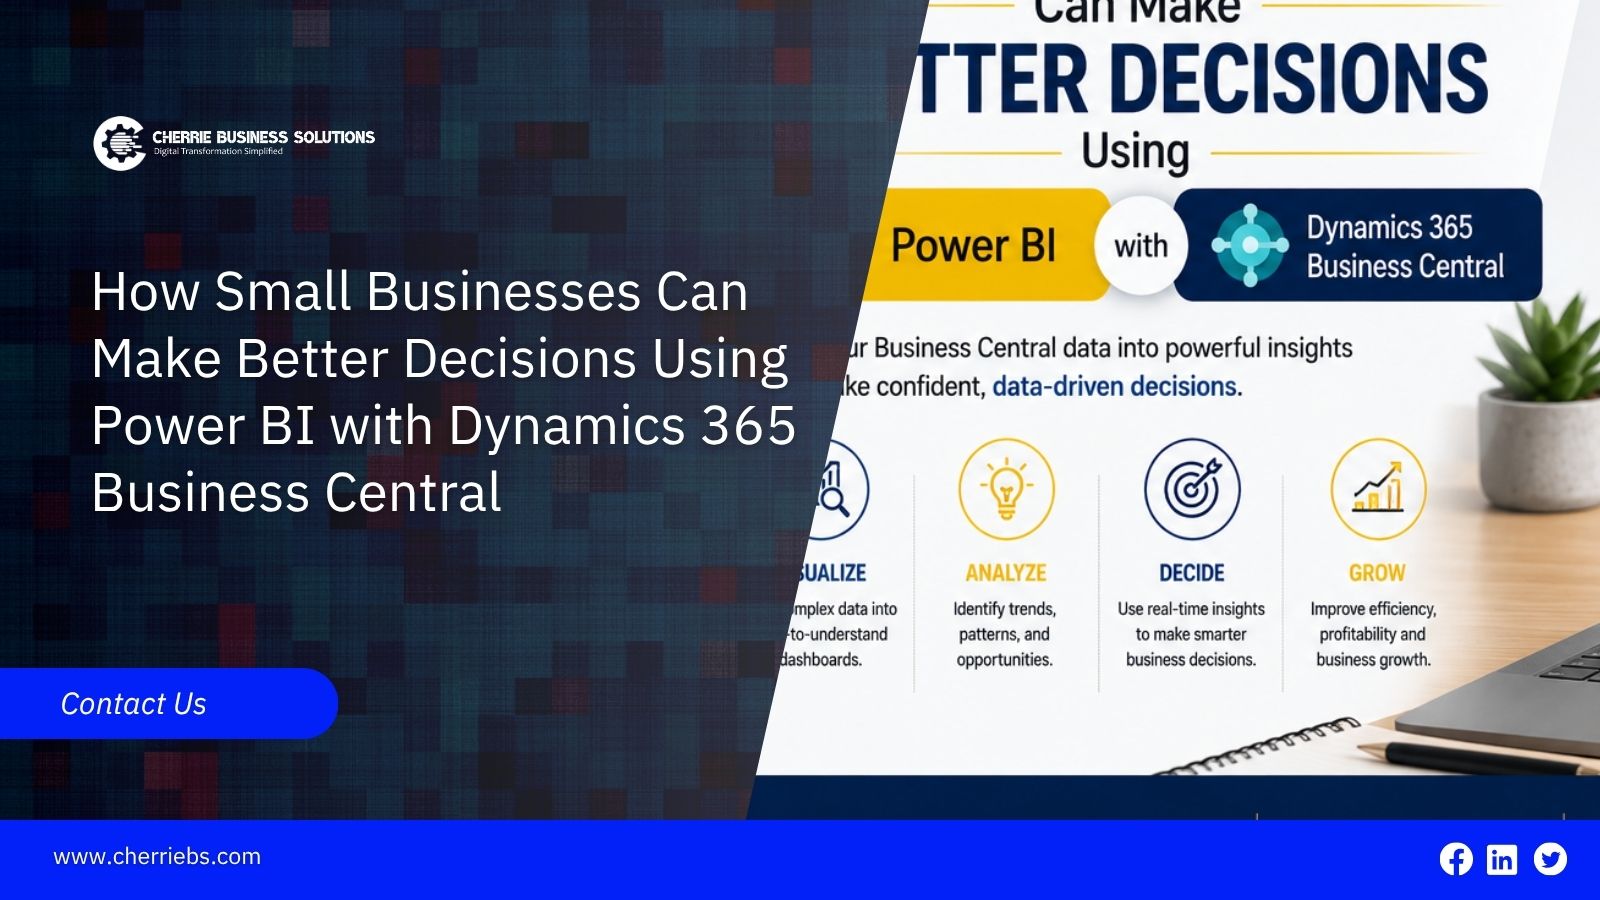
Running a small business means making tough calls on inventory, vendor payments, and cash flow every single day. The problem is that most leaders still base these choices on outdated reports or assumptions. While Microsoft Dynamics 365 Business Central captures all your daily operations perfectly, staring at rows of raw numbers will give you data, but it does not give you a clear strategy.
Connecting Power BI to your Dynamics 365 ERP changes how you run your company. This native integration turns complicated financial data into clear visual dashboards. As an official implementation partner, we see firsthand how this setup helps smaller teams stop guessing and start making highly accurate, data-driven decisions.
Before exploring these practical use cases, let's first understand the basics.
What is Power BI and How Does It Work with Dynamics 365 Business Central?
Power BI is a data visualization platform built by Microsoft. It takes raw numbers from various sources and turns them into interactive charts, graphs, and visual reports. When paired with Dynamics 365 Business Central, it acts as the analytical intelligence for your ERP system. The two platforms can be connected seamlessly through built-in application integrations. You do not need to export files or write complex code to make them work together.
Business Central acts as the secure vault that stores your daily transactions. Meanwhile, Power BI uses native features like Data Analysis Expressions to calculate profit margins and visualize business trends automatically based on that vault of information. This native connection means your visual reports can stay closely aligned with your operational data through scheduled refreshes or live connections.
Understanding the technology is only the first part of the equation. Applying these tools to your daily workflows is where you see a real return on investment.
Here are the practical ways small businesses use this integration to make better choices.
1. Access Near Real-Time ERP Data to Eliminate Reporting Delays
Many growing companies still run their weekly meetings using manual spreadsheet exports. By the time leadership reviews a formatted document, the information is several days old. You cannot fix a sudden cash flow shortage or an inventory stockout using outdated metrics.
Power BI can connect directly to Business Central data sources through APIs, OData feeds, or live connections, depending on the deployment architecture. This tool pulls data natively from your Microsoft Dynamics 365 ERP as things happen. When a warehouse employee logs a new shipment receipt in Business Central, your dashboards can update automatically based on configured refresh schedules or live connections. When a client pays an invoice, your revenue charts update automatically based on your configured refresh settings. This live connection ensures that your leadership team always bases their financial choices on the current reality of the company, not last week's news.
Having live numbers is a strong foundation, but the real business value appears when you start mixing data from different departments.
2. Combine Department Metrics to Reveal Hidden Supply Chain Trends
A common issue in small businesses is that departments operate in complete isolation. The sales team focuses entirely on revenue targets, while procurement focuses on vendor costs. Because they look at different software screens, they rarely see how their actions impact one another. This disconnect often causes salespeople to promise quick deliveries for items that are currently stuck on a cargo ship.
Power BI uses advanced Data Modeling capabilities to combine these different areas into one interactive dashboard. Consider a mid-sized building materials distributor operating in Dubai. By viewing active sales quotes next to current inventory levels, their purchasing manager can spot a sudden spike in demand for specific commercial materials. They can proactively order more stock from suppliers before the sales team even closes the deals. This cross-departmental visibility helps you prevent supply chain bottlenecks and keeps your clients happy.
Viewing all your company metrics in one place is helpful, but your team also needs a fast way to interact with those visuals during busy workdays.
3. Ask Copilot for Instant Answers Instead of Building Complex Reports
One of the biggest barriers to adopting data analytics is the technical learning curve. Small businesses typically don’t have the budget to hire a dedicated data analyst. If a sales manager needs a highly specific chart, they usually have to wait days for an IT consultant to build it.
Microsoft solves this technical hurdle by integrating Copilot directly into Power BI and Business Central. Because your ERP data is already neatly organized in the background, you can ask direct questions to the integrated AI assistant, Copilot. A sales director can simply type "Show me total revenue by product category for last quarter" into the chat interface. The AI inside the software reads the query, scans the Business Central records, and instantly generates a clear chart to answer it. This AI assistant empowers anyone in your company to find the metrics they need instantly, keeping your daily work moving fast.
Empowering your staff to find their own answers boosts productivity, but you must also control who is allowed to see sensitive numbers.
4. Apply Role-Based Security to Share Financial Data Safely
A major reason small business owners hesitate to share performance dashboards is confidentiality. You want regional sales managers to see their specific territory numbers so they can track their goals. At the same time, you certainly don’t want them viewing the total company payroll or vendor profit margins.
Power BI handles this security challenge smoothly through a feature called Row Level Security. Your ERP partner only needs to build one master dashboard connected to Business Central. The system then looks at the login credentials of the person viewing the screen and filters the data based on their specific job role. A junior representative only sees their assigned clients, while the company owner sees the global revenue numbers across all regions on the same dashboard. You can build a data-driven culture within your team while keeping your sensitive financial records completely locked down.
Securing your current data protects your business today. Analyzing that information to forecast future activity helps you protect your business tomorrow.
5. Review Predictive Analytics to Improve Cash Flow Planning
Small businesses spend a lot of time reacting to things that have already happened. Reviewing last month's profit margin is necessary for accounting purposes, but it does not tell you what decisions you should make next week. To grow securely, you need to look forward.
Power BI forecasting tools and AI capabilities can identify patterns and project future trends based on historical data. The software analyzes past sales cycles, seasonal revenue dips, and average customer payment speeds. It generates trend lines showing where your cash flow is likely heading over the next ninety days. If your clients historically pay their invoices more slowly during the summer months, the system will highlight a potential cash flow dip well before the season begins. This predictive ability gives business owners the lead time they need to secure a short-term credit line or delay a large equipment purchase.
Conclusion
The ultimate goal of any ERP investment is to gain clear and actionable insights that drive the business forward. When executives no longer have to reconcile conflicting reports from different departments, the organization can move with much greater agility. Integrating Power BI with Microsoft Dynamics 365 Business Central provides the unified visibility to help your company make better decisions.
Achieving this level of integration demands a well-planned technical approach. Cherrie Business Solutions specializes in guiding companies through this transition. As an official implementation partner, we ensure your data models are structured correctly and your dashboards reflect real operational metrics. We handle the complex backend configuration, so your team can step into a fully optimized reporting environment. Reach out to our team today to build secure, data-driven ERP solutions.